Bringing Chemical Insight to 3D Imaging—Non-Destructively, in a Single Scan
Having over a decade-long hands-on experience with micro-CT, scanned hundreds of samples and being amazed by new findings of their internal structure, one thing always came back as a question: What is the chemical composition of the features I see in 3D visualizations? It was always clear to me, that this is one of the main limits of the data I collected, although the chemical information is often equally important as the feature’s sizes, shapes or presence in the analyzed volume. I spent half my Ph.D. matching micro-CT with other methods such as (micro-)x-ray fluorescence (XRF), x-ray diffraction (XRD), or energy-dispersive spectroscopy (EDS) in an electron microscope. The goal was always the same—to match structural micro-CT data with the chemical data. This was not an easy task, as all of these methods often require destructive sample preparation—which may result in specimen chemical change— and cannot be easily applied to large 3D volumes. Never mind the fact that matching the chemical composition of a small feature present in a large volume may require highly manual, precise, and time-consuming isolation of the specimen from already micro-CT analyzed sample.
But now, recent developments at TESCAN micro-CT have finally solved this. Chemical analysis is enabled by the TESCAN SPECTRAL CT innovation. For the first time, it is now possible to characterize sample structure and chemical composition in three dimensions non-destructively using a single micro-CT solution. I’m thrilled about this new technology and even more excited about applications that are enabled by this, not only as a TESCAN PMM, but even more so as a micro-CT researcher.
The application range is ultimately extremely broad, TESCAN SPECTRAL CT makes it possible for instance to identify precious metals in ore samples for mining. Without using any other method than micro-CT, we can clearly tell if the dense spots displayed in the sample are gold, platinum, or lead – a quite important distinction to make for the mining industry, as you can imagine. In the example below (Figure 1) you can see a gold-bearing rock core we scanned, and without the need for any additional information by SEM or XRF analysis, we can identify dense grains, and verify that they are indeed gold grains.
But there are other potential applications as well, SPECTRAL CT helps to pinpoint specific components based on their chemical composition in (micro-)electronics for recycling purposes, distinguish different polymers or potentially identify chemical contaminations in various products.
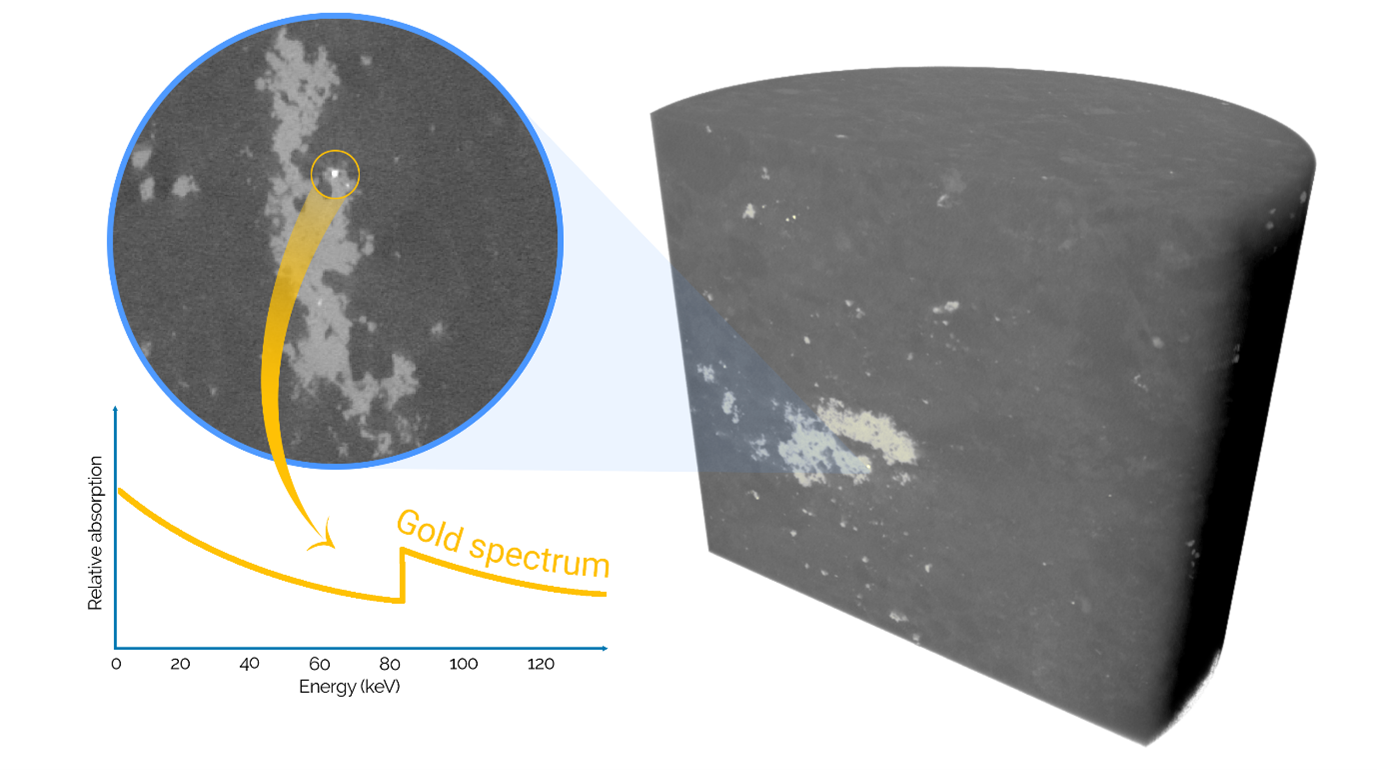
Figure 1: Identification of gold particles inside a 1.5 inch diameter rock core based on
k-edge imaging.
How does it work technically? We basically analyze the full spectrum of x-rays projected from the sample and that enables differentiation between materials which would show equal contrast with conventional micro-CT projection otherwise. Additionally, dividing the detected spectrum according to their individual x-ray energies provides additional level of information between different polymers, tissues, or other materials. This is done by multi-energy CT scanning using a single scan (Figure 2).
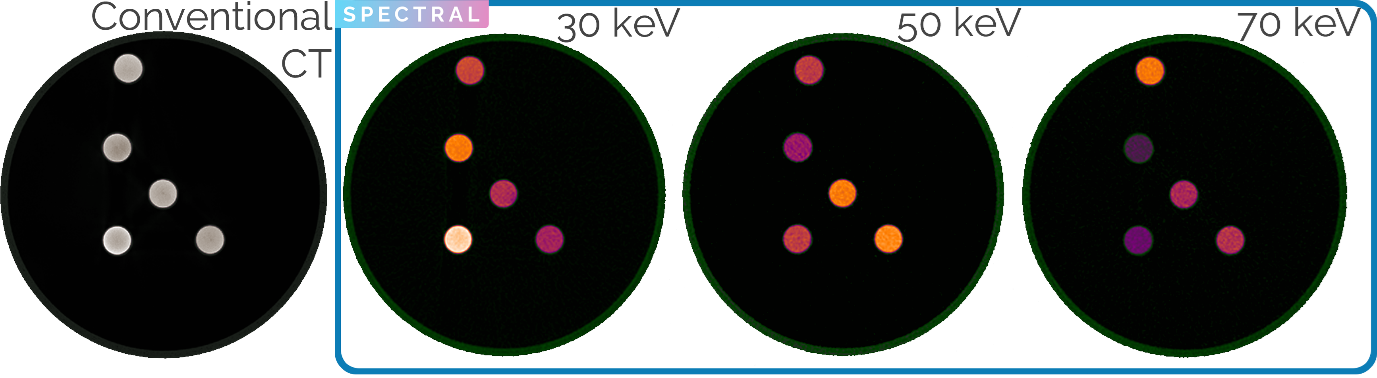
Figure 2: Where conventional micro-CT (left) does not show any contrast, analyzing different energy bins allows full analysis and segmentation of materials.
There’s a vast number of advantages for SPECTRAL CT in materials science, life sciences, earth science and engineering, but the true strength of SPECTRAL CT comes with the direct correlation of chemical information coming from SPECTRAL CT and high quality and high-resolution structural information delivered by conventional CT scanning process. In my view, this case is clearly an example where one plus one truly is three.
TESCAN SPECTRAL CT is available in the TESCAN UniTOM XL – or its CoreTOM smaller brother – and can be retrofitted to existing installs. The integration provides a one-click switch from SPECTRAL to conventional, a direct match between the two methods, and a large number of analysis tools to get the most out of SPECTRAL CT data.
To learn more visit info.tescan.com/tescan-spectral-CT

Wesley De Boever
Product marketing Manager for TESCAN micro-CT