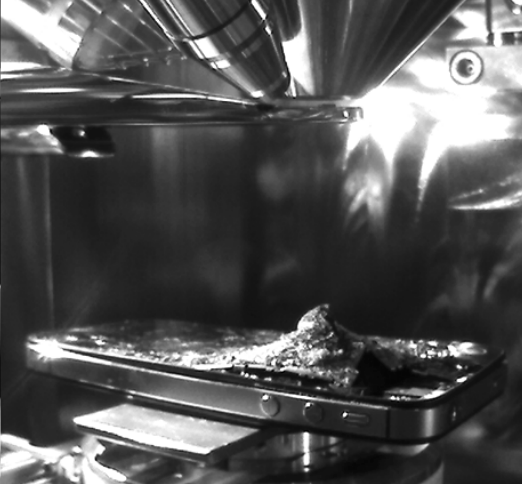
This application illustrates how scanning electron microscopy (SEM), energy dispersive spectroscopy (EDS) and x-ray micro-computed tomography (CT) can be used for the analysis of glass particles, in order to link them to the glass covering a smartphone. A simulated trace evidence scenario was produced by subjecting an iPhone 4S to a gunshot, generating glass particles from the iPhone’s front and back covers. These particles were collected and served as an ideal case-study for particle analysis and comparison. The condition of the iPhone was documented in a TESCAN VEGA SEM before and after the test-firing (Fig. 1) to document the resulting damage that caused particles to be generated. Imaging the entire phone required the use of a large chamber and stage, variable pressure conditions, wide-field scanning, panorama image stitching, stereo image acquisition, 3D reconstruction, large area EDS x-ray mapping, and SEM/EDS particle analysis. X-ray CT analysis of the iPhone was also performed, and the results were used to create a direct correlation to the results of the SEM 3D image reconstruction.
The glass covering the iPhone is non-conductive, so the SEM electron beam causes charging of the iPhone surface, which creates artifacts in the image. These charging effects are mitigated by imaging in variable pressure mode and at low-voltage working conditions in the SEM. Top-down SEM imaging of the entrance and exit is useful to visualize coarse and fine detail, but provides little information about the Z-dimension of the surface (Fig. 2a & Fig. 2c). Stereo imaging and 3D analysis reveal that the bullet partially exited from the backside of the iPhone. SEM stereo images are created by imaging the same field-of-view and tilting the stage to different angles for collection of the image pair. These source images are then combined into a single picture with each image in a separate color plane, called an anaglyph image. A stereo anaglyph image presents a three-dimensional view of the surface by relying on the human visual system to perceive the disparity of a single point in the images as depth. The set of images can also be processed to create a digital elevation model (DEM), which reveal quantifiable details of the surface. The image processing detects the same point in both source images, calculates the relative
height of each point in the field-of-view, creates a polygon model of the surface, overlays it with the SEM image data for texture and shading, and encodes height by color mapping (Fig. 2b & Fig. 2d).
Imaging in 3D with the SEM provides an efficient way to analyze three-dimensional topographic features of the sample’s surface. However, to investigate the morphology and damage patterns on the inside of the phone, a complementary approach is required. X-ray micro-computed tomography (micro-CT) can be usedfor non-destructive 3D imaging of the full phone volume.
For this analysis, a TESCAN UniTOM XL was used to visualize the entire iPhone volume. The x-ray tomogram (Fig. 3a) confirms that the bullet remained in the iPhone, only partially penetrating the back side. The bullet clearly went through the battery (Fig. 3b), and bullet fragments are shattered throughout the phone. Of course, external features such as the fractured glass surface can be studied using micro-CT. Furthermore, the 3D volume can be used as a navigation tool for the SEM and other techniques, to reach precise locations in a correlative workflow (Fig. 3c).
Forensic scientists use a wide range of information to determine the origin and nature of evidence. For example, the iPhone cover is made from an alkali-aluminosilicate glass sheet that gains its surface strength, ability to contain flaws, and crack-resistance through immersion in a proprietary, potassium-salt ion-exchange bath during manufacturing. This results in the surface of the glass being enriched in potassium and depleted in sodium, to a depth of tens of micrometers. This unique chemical profile can be used to determine how the iPhone glass fragments may be distributed and to distinguish them from other particles in samples that are collected at various locations. Fig. 4a-d show the same area of the front side of the iPhone. Panoramic imaging, using TESCAN’s Image Snapper tool, is a powerful complement to wide-field imaging.
While wide field imaging collects a single image over a very large field of view, panoramic imaging involves collecting an array of image tiles over a large area. The stitched panorama provides both a large field overview and high-resolution image information at the same time. Acquiring optical, backscatter, and x-ray data at a fine spatial resolution over a large area allows correlation of coarse and fine detail in the fractured surface of the phone. Each image (Fig. 4a-d) can be loaded into the TESCAN Positioner tool, calibrated to the stage and used as a multilayer map to navigate across the sample and define areas for further analysis.
While the surface of the iPhone did not feature many particles, the container holding the iPhone during the test firing collected many of them. Some of these particles were collected on an SEM stub, and the SEM panorama image of this stub is shown in Fig. 5a. High magnification imaging, as shown in Fig. 5b, revealed that many of the particles exhibit one very flat surface with other surfaces that show features that are typical of glass fracture. The x-ray map of the field-of-view shows randomly dispersed particles, with some having a sodium-rich surface and some having a potassium-rich surface (Fig. 5c).
The difference in sodium and potassium content is explained by the aforementioned salt bath that is used during manufacturing, and the fact that some particles on the tape were collected with the original surface of the display facing upward, while others landed with the fracture surface of the interior of the glass sheet facing upward. A linescan across the edge of a single particle (Fig. 6a) shows the phase relationship. This is shown in an x-ray map, x-ray linescan (Fig. 6b) and comparison of x-ray spectra (Fig. 6c).
Conclusions
This application note demonstrates the ability of the TESCAN VEGA SEM to establish a match between a glass particle and its source on the surface of an iPhone with SEM, EDS, and micro-CT analyses. The use of variable pressure imaging conditions, as well as wide field, depth, and resolution scan modes were critical for image acquisition. The TESCAN Image Snapper tool was used extensively to create panorama images which enabled the correlation of SEM, micro-CT, EDS and optical data. SEM 3D reconstruction and micro-CT imaging were used to correlate the surface and topography, as well as to give insight into the damage within the phone. Finally, EDS microanalysis data in the form of spectra, line scan, mapping, and large area mapping were acquired from samples to characterize the compositional variations within the glass, which provides corroborating evidence of the origin of the glass.